
Page 129 - CIWA Water Data Revolution Overview Report
P. 129
basins where multiple countries share the water resources, and data sharing and
transparency are significant bottlenecks for integrated water resources management.
4.1 Tableau Public Architecture
The Tableau-based Water Accounting Dashboard is built to support visualizing, analyzing, and
managing water resources in various river basins. Tableau was chosen for the Water
Accounting Dashboard because of its powerful data visualization capabilities, user-friendly
interface, and ability to handle complex datasets effectively. Compared to other tools,
Tableau allows for dynamic interaction, real-time data updates, and customization to support
stakeholders in visualizing, analyzing, and managing water resources across various basins.
The dashboard offers key insights into water balance, water availability, water indicators, and
climate impact, aiding stakeholders in informed decision-making and sustainable resource
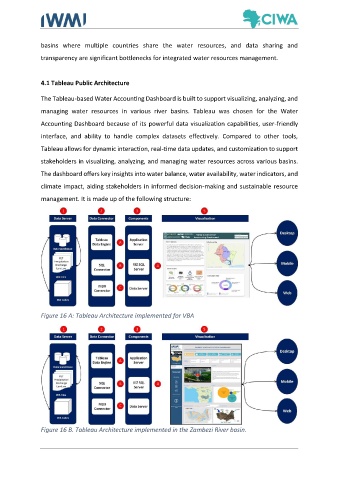
management. It is made up of the following structure:
Figure 16 A: Tableau Architecture implemented for VBA
Figure 16 B. Tableau Architecture implemented in the Zambezi River basin.