
Page 124 - CIWA Water Data Revolution Overview Report
P. 124
60
Water Accounts Km 3 40
50
30
20
10
0
2003 2004 2005 2006 2007 2008 2009 2010 2011 2012 2013 2014 2015 2016 2017 2018 2019 2020 2021
Rainfall Total ET Outflow Utilizable Outflow
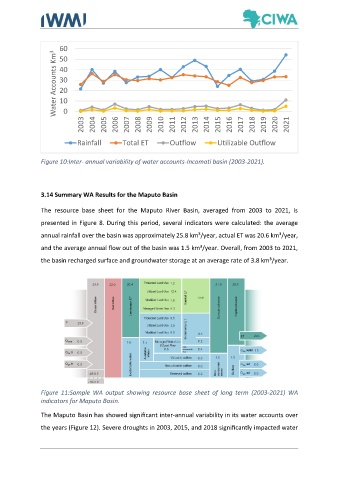
Figure 10:Inter- annual variability of water accounts-Incomati basin (2003-2021).
3.14 Summary WA Results for the Maputo Basin
The resource base sheet for the Maputo River Basin, averaged from 2003 to 2021, is
presented in Figure 8. During this period, several indicators were calculated: the average
annual rainfall over the basin was approximately 25.8 km³/year, actual ET was 20.6 km³/year,
and the average annual flow out of the basin was 1.5 km³/year. Overall, from 2003 to 2021,
the basin recharged surface and groundwater storage at an average rate of 3.8 km³/year.
Figure 11:Sample WA output showing resource base sheet of long term (2003-2021) WA
indicators for Maputo Basin.
The Maputo Basin has showed significant inter-annual variability in its water accounts over
the years (Figure 12). Severe droughts in 2003, 2015, and 2018 significantly impacted water