
Page 127 - CIWA Water Data Revolution Overview Report
P. 127
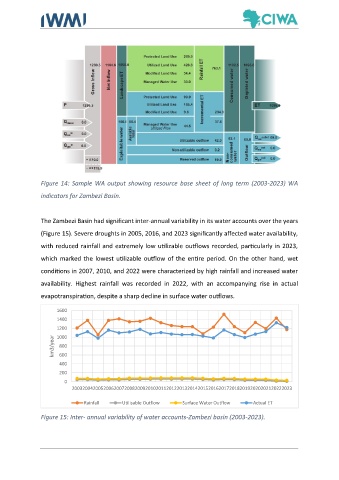
Figure 14: Sample WA output showing resource base sheet of long term (2003-2023) WA
               indicators for Zambezi Basin.


               The Zambezi Basin had significant inter-annual variability in its water accounts over the years
               (Figure 15). Severe droughts in 2005, 2016, and 2023 significantly affected water availability,

               with reduced rainfall and extremely low utilizable outflows recorded, particularly in 2023,

               which marked the lowest utilizable outflow of the entire period. On the other  hand, wet

               conditions in 2007, 2010, and 2022 were characterized by high rainfall and increased water

               availability.  Highest  rainfall  was  recorded  in  2022,  with  an  accompanying  rise  in  actual
               evapotranspiration, despite a sharp decline in surface water outflows.


                     1600
                     1400
                     1200
                     1000
                    km3/year  800

                      600
                      400
                      200
                        0
                          200320042005200620072008200920102011201220132014201520162017201820192020202120222023

                               Rainfall     Utilisable Outflow   Surface Water Outflow    Actual ET

               Figure 15: Inter- annual variability of water accounts-Zambezi basin (2003-2023).