
Page 132 - CIWA Water Data Revolution Overview Report
P. 132
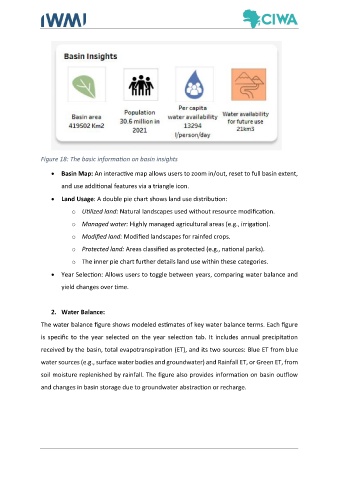
Figure 18: The basic information on basin insights

                   •  Basin Map: An interactive map allows users to zoom in/out, reset to full basin extent,

                       and use additional features via a triangle icon.

                   •  Land Usage: A double pie chart shows land use distribution:

                          o  Utilized land: Natural landscapes used without resource modification.
                          o  Managed water: Highly managed agricultural areas (e.g., irrigation).

                          o  Modified land: Modified landscapes for rainfed crops.

                          o  Protected land: Areas classified as protected (e.g., national parks).

                          o  The inner pie chart further details land use within these categories.

                   •  Year Selection: Allows users to toggle between years, comparing water balance and
                       yield changes over time.


                   2.  Water Balance:
               The water balance figure shows modeled estimates of key water balance terms. Each figure

               is  specific  to  the  year  selected  on  the  year  selection  tab.  It  includes annual  precipitation

               received by the basin, total evapotranspiration (ET), and its two sources: Blue ET from blue

               water sources (e.g., surface water bodies and groundwater) and Rainfall ET, or Green ET, from

               soil moisture replenished by rainfall. The figure also provides information on basin outflow
               and changes in basin storage due to groundwater abstraction or recharge.