
Page 131 - CIWA Water Data Revolution Overview Report
P. 131
management. Built using Tableau, the dashboard facilitates the visualization of complex
water data, making it accessible to a range of stakeholders, including policymakers, scientists,
and the general public.
Dashboard Key Features:
1. Basin Overview
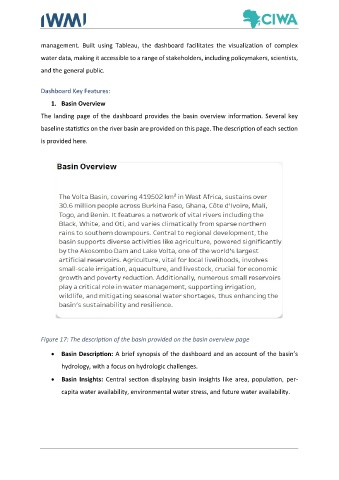
The landing page of the dashboard provides the basin overview information. Several key
baseline statistics on the river basin are provided on this page. The description of each section
is provided here.
Figure 17: The description of the basin provided on the basin overview page
• Basin Description: A brief synopsis of the dashboard and an account of the basin’s
hydrology, with a focus on hydrologic challenges.
• Basin Insights: Central section displaying basin insights like area, population, per-
capita water availability, environmental water stress, and future water availability.