
Page 126 - CIWA Water Data Revolution Overview Report
P. 126
significant share of 24 % of the hydroelectricity generation contribution to the Southern
8
African Power Pool.
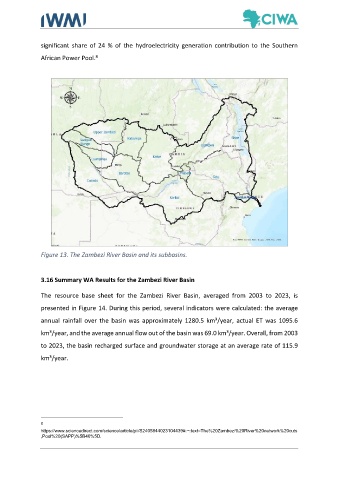
Figure 13. The Zambezi River Basin and its subbasins.
3.16 Summary WA Results for the Zambezi River Basin
The resource base sheet for the Zambezi River Basin, averaged from 2003 to 2023, is
presented in Figure 14. During this period, several indicators were calculated: the average
annual rainfall over the basin was approximately 1280.5 km³/year, actual ET was 1095.6
km³/year, and the average annual flow out of the basin was 69.0 km³/year. Overall, from 2003
to 2023, the basin recharged surface and groundwater storage at an average rate of 115.9
km³/year.
8
https://www.sciencedirect.com/science/article/pii/S2405844023104439#:~:text=The%20Zambezi%20River%20network%20cuts
,Pool%20(SAPP)%5B46%5D.