
Page 133 - CIWA Water Data Revolution Overview Report
P. 133
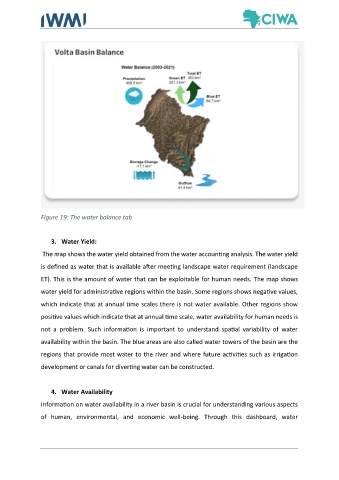
Figure 19: The water balance tab


                   3.  Water Yield:

                The map shows the water yield obtained from the water accounting analysis. The water yield

               is defined as water that is available after meeting landscape water requirement (landscape
               ET). This is the amount of water that can be exploitable for human needs. The map shows

               water yield for administrative regions within the basin. Some regions shows negative values,

               which indicate that at annual time scales there is not water available. Other regions show

               positive values which indicate that at annual time scale, water availability for human needs is

               not  a  problem.  Such  information  is  important  to  understand  spatial  variability  of  water
               availability within the basin. The blue areas are also called water towers of the basin are the

               regions that provide most water to the river and where future activities such as irrigation

               development or canals for diverting water can be constructed.


                   4.  Water Availability

               Information on water availability in a river basin is crucial for understanding various aspects

               of  human,  environmental,  and  economic  well-being.  Through  this  dashboard,  water