
Page 12 - CIWA’s FCV Framework
P. 12
CIWA Climate Resilience & mitigation Assessment
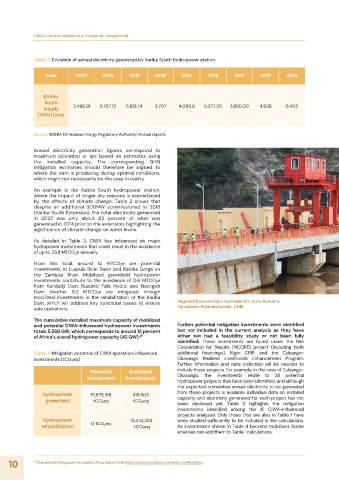
Table 2: Evolution of annual electricity generated by Kariba South Hydropower station.
Year 2023 2022 2021 2020 2019 2018 2017 2015 2014
Kariba
South
supply 3,496.91 5,757.10 5,813.74 3,707 4,095.6 5,377.30 3,850.00 4,938 5,403
(GWh)/year
Source: ©ZERA (Zimbabwe Energy Regulatory Authority) Annual reports
Annual electricity generation figures correspond to
maximum operation or are based on estimates using
the installed capacity. The corresponding GHG
mitigation estimates should therefore be aligned to
where the dam is producing during optimal conditions,
which might not necessarily be the case in reality.
An example is the Kariba South hydropower station,
where the impact of longer dry seasons is exacerbated
by the effects of climate change. Table 2 shows that
despite an additional 300MW commissioned in 2018
(Kariba South Extension), the total electricity generated
in 2023 was only about 65 percent of what was
generated in 2014 prior to the extension, highlighting the
significance of climate change on water levels.
As detailed in Table 3, CIWA has influenced six major
hydropower investments that could result in the avoidance
of up to 23.8 MTCO₂e annually.
From this total, around 14 MTCO₂e are potential
investments, in Luapula River Basin and Batoka Gorge on
the Zambezi River. Mobilized greenfield hydropower
investments contribute to the avoidance of 0.6 MTCO₂e
from Kandadji Dam, Rusumo Falls Hydro, and Nsongezi
Dam. Another 9.2 MTCO₂e are mitigated through
mobilized investments in the rehabilitation of the Kariba
Dam, which will address key structural issues to ensure Regional Rusumo Falls Hydroelectric Dam, Rusumo,
safe operations. Tanzanian-Rwanda border. ©NBI
The cumulative installed maximum capacity of mobilized
and potential CIWA-influenced hydropower investments Further potential mitigation investments were identified
totals 5.568 GW, which corresponds to around 13 percent but not included in the current analysis as they have
of Africa’s overall hydropower capacity (42 GW).²⁵ either not had a feasibility study or not been fully
identified. These investments are found under the Nile
Cooperation for Results (NCORE) project (including both
Table 3: Mitigation potential of CIWA operation-influenced additional financings), Niger CRIP, and the Cubango-
investments (tCO₂eq) Okavango Resilient Livelihoods Enhancement Program.
Further information and data collection will be needed to
Potential Mobilized include these projects. For example, in the case of Cubango-
investment investments Okavango, the investments relate to 28 potential
hydropower projects that have been identified, and although
the expected cumulative annual electricity to be generated
Hydropower 15,678,186 418,503 from these projects is available, individual data on installed
greenfield tCO₂eq tCO₂eq capacity and electricity generated for each project has not
been disclosed yet. Table 3 highlights the mitigation
investments identified among the 41 CIWA-influenced
projects analyzed. Only those that are also in Table 1 have
Hydropower 10,374,333 been studied sufficiently to be included in the calculations.
rehabilitation 0 tCO₂eq tCO₂eq As investments shown in Table 4 become mobilized, future
analyses can add them to Table 1 calculations.
10 ²⁵ International Hydropower Association, Africa Region Profile https://www.hydropower.org/region-profiles/africa