
Page 32 - CIWA Water Data Revolution Overview Report
P. 32
Water Data Revolution: Closing the data gap for transboundary water in Africa
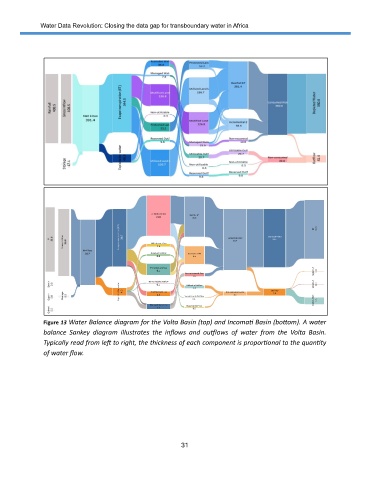
Figure 13 Water Balance diagram for the Volta Basin (top) and Incomati Basin (bottom). A water
balance Sankey diagram illustrates the inflows and outflows of water from the Volta Basin.
Typically read from left to right, the thickness of each component is proportional to the quantity
of water flow.
31