
Page 29 - CIWA Water Data Revolution Overview Report
P. 29
Water Data Revolution: Closing the data gap for transboundary water in Africa
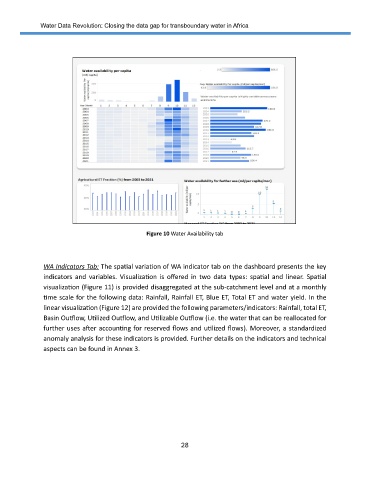
Figure 10 Water Availability tab
WA Indicators Tab: The spatial variation of WA indicator tab on the dashboard presents the key
indicators and variables. Visualization is offered in two data types: spatial and linear. Spatial
visualization (Figure 11) is provided disaggregated at the sub-catchment level and at a monthly
time scale for the following data: Rainfall, Rainfall ET, Blue ET, Total ET and water yield. In the
linear visualization (Figure 12) are provided the following parameters/indicators: Rainfall, total ET,
Basin Outflow, Utilized Outflow, and Utilizable Outflow (i.e. the water that can be reallocated for
further uses after accounting for reserved flows and utilized flows). Moreover, a standardized
anomaly analysis for these indicators is provided. Further details on the indicators and technical
aspects can be found in Annex 3.
28