
Page 163 - CIWA Water Data Revolution Overview Report
P. 163
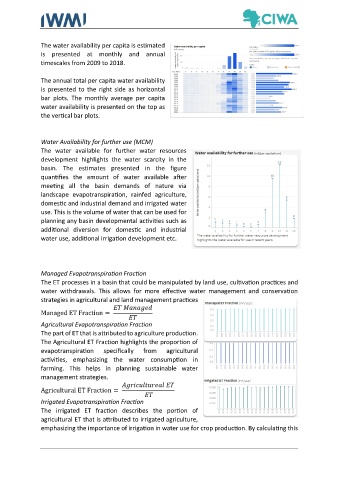
The water availability per capita is estimated
               is  presented  at  monthly  and  annual
               timescales from 2009 to 2018.

               The annual total per capita water availability
               is  presented  to  the  right  side  as  horizontal
               bar  plots.  The  monthly  average  per  capita
               water availability is presented on the top as
               the vertical bar plots.


               Water Availability for further use (MCM)
               The  water  available  for  further  water  resources
               development  highlights  the  water  scarcity  in  the
               basin.  The  estimates  presented  in  the  figure
               quantifies  the  amount  of  water  available  after
               meeting  all  the  basin  demands  of  nature  via
               landscape  evapotranspiration,  rainfed  agriculture,
               domestic and industrial demand and irrigated water
               use. This is the volume of water that can be used for
               planning any basin developmental activities such as
               additional  diversion  for  domestic  and  industrial
               water use, additional irrigation development etc.


               Managed Evapotranspiration Fraction
               The ET processes in a basin that could be manipulated by land use, cultivation practices and
               water  withdrawals.  This  allows  for  more  effective  water  management  and  conservation
               strategies in agricultural and land management practices

               Managed ET Fraction =

               Agricultural Evapotranspiration Fraction
               The part of ET that is attributed to agriculture production.
               The Agricultural ET Fraction highlights the proportion of
               evapotranspiration    specifically   from   agricultural
               activities,  emphasizing  the  water  consumption  in
               farming.  This  helps  in  planning  sustainable  water
               management strategies.

               Agricultural ET Fraction =

               Irrigated Evapotranspiration Fraction
               The  irrigated  ET  fraction  describes  the  portion  of
               agricultural ET that is attributed to irrigated agriculture,
               emphasizing the importance of irrigation in water use for crop production. By calculating this