
Page 162 - CIWA Water Data Revolution Overview Report
P. 162
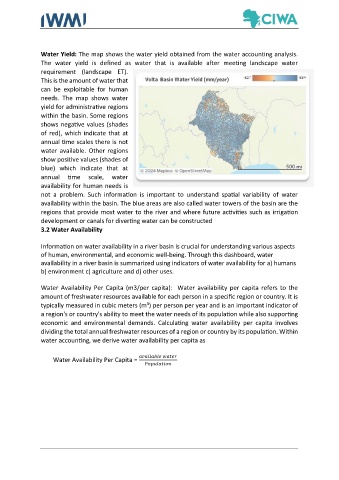
Water Yield: The map shows the water yield obtained from the water accounting analysis.
               The  water  yield  is  defined  as  water  that  is  available  after  meeting  landscape  water
               requirement  (landscape  ET).
               This is the amount of water that
               can  be  exploitable  for  human
               needs.  The  map  shows  water
               yield for administrative regions
               within the basin. Some regions
               shows negative values (shades
               of red), which indicate that at
               annual time scales there is not
               water  available.  Other  regions
               show positive values (shades of
               blue)  which  indicate  that  at
               annual  time  scale,  water
               availability for human needs is
               not  a  problem.  Such  information  is  important  to  understand  spatial  variability  of  water
               availability within the basin. The blue areas are also called water towers of the basin are the
               regions that provide most water to the river and where future activities such as irrigation
               development or canals for diverting water can be constructed
               3.2 Water Availability

               Information on water availability in a river basin is crucial for understanding various aspects
               of human, environmental, and economic well-being. Through this dashboard, water
               availability in a river basin is summarized using indicators of water availability for a) humans
               b) environment c) agriculture and d) other uses.

               Water  Availability  Per  Capita  (m3/per  capita):   Water  availability  per  capita  refers  to  the
               amount of freshwater resources available for each person in a specific region or country. It is
               typically measured in cubic meters (m³) per person per year and is an important indicator of
               a region's or country's ability to meet the water needs of its population while also supporting
               economic  and  environmental  demands.  Calculating  water  availability  per  capita  involves
               dividing the total annual freshwater resources of a region or country by its population. Within
               water accounting, we derive water availability per capita as


                    Water Availability Per Capita =
