
Page 167 - CIWA Water Data Revolution Overview Report
P. 167
3.4 Spatial Variation of WA Indicators
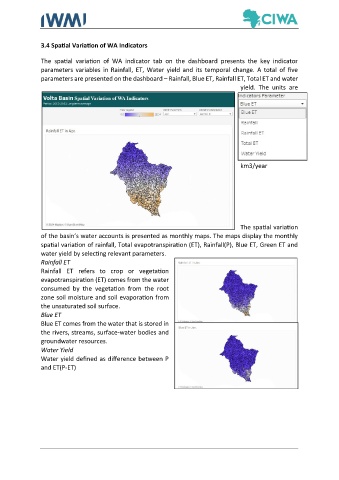
The spatial variation of WA indicator tab on the dashboard presents the key indicator
parameters variables in Rainfall, ET, Water yield and its temporal change. A total of five
parameters are presented on the dashboard – Rainfall, Blue ET, Rainfall ET, Total ET and water
yield. The units are
km3/year
The spatial variation
of the basin’s water accounts is presented as monthly maps. The maps display the monthly
spatial variation of rainfall, Total evapotranspiration (ET), Rainfall(P), Blue ET, Green ET and
water yield by selecting relevant parameters.
Rainfall ET
Rainfall ET refers to crop or vegetation
evapotranspiration (ET) comes from the water
consumed by the vegetation from the root
zone soil moisture and soil evaporation from
the unsaturated soil surface.
Blue ET
Blue ET comes from the water that is stored in
the rivers, streams, surface-water bodies and
groundwater resources.
Water Yield
Water yield defined as difference between P
and ET(P-ET)