
Page 170 - CIWA Water Data Revolution Overview Report
P. 170
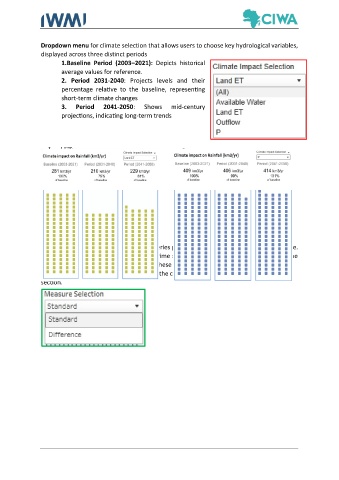
Dropdown menu for climate selection that allows users to choose key hydrological variables,
               displayed across three distinct periods
                       1.Baseline  Period  (2003–2021):  Depicts  historical
                       average values for reference.
                       2.  Period  2031-2040:  Projects  levels  and  their
                       percentage  relative  to  the  baseline,  representing
                       short-term climate changes
                       3.   Period   2041-2050:     Shows    mid-century
                       projections, indicating long-term trends


                 Land ET                                         P


               The right side of the tab displays the time series plots in two formats: Standard and Difference.
               The Standard format presents the annual time series of key hydrological variables, while the
               Difference format shows the deviation of these variables from their long-term average.
               Users can choose the desired format from the dropdown menu in the “Measure Selection”
               section.