
Page 161 - CIWA Water Data Revolution Overview Report
P. 161
The inner pie chart shows the distribution of various classes that are classified/grouped into
the board four categories.
Year Selection: The year selection tab helps users access overview of water balance and
basin water yield information. The users can click and toggle between years to compare how
water balance can changes over time.
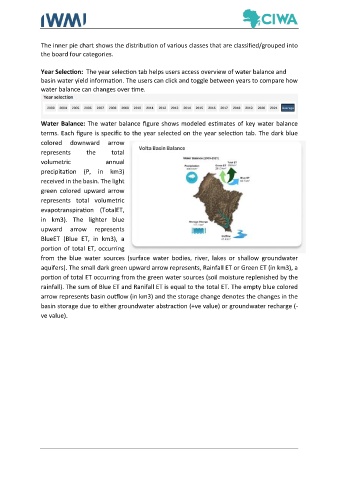
Water Balance: The water balance figure shows modeled estimates of key water balance
terms. Each figure is specific to the year selected on the year selection tab. The dark blue
colored downward arrow
represents the total
volumetric annual
precipitation (P, in km3)
received in the basin. The light
green colored upward arrow
represents total volumetric
evapotranspiration (TotalET,
in km3). The lighter blue
upward arrow represents
BlueET (Blue ET, in km3), a
portion of total ET, occurring
from the blue water sources (surface water bodies, river, lakes or shallow groundwater
aquifers). The small dark green upward arrow represents, Rainfall ET or Green ET (in km3), a
portion of total ET occurring from the green water sources (soil moisture replenished by the
rainfall). The sum of Blue ET and Ranifall ET is equal to the total ET. The empty blue colored
arrow represents basin outflow (in km3) and the storage change denotes the changes in the
basin storage due to either groundwater abstraction (+ve value) or groundwater recharge (-
ve value).