
Page 112 - CIWA Water Data Revolution Overview Report
P. 112
to the pixel-based water balance model. The model was used to generate the water accounts
for the basin under current conditions.
3.5 Summary Water Accounting Results for the Volta River basin
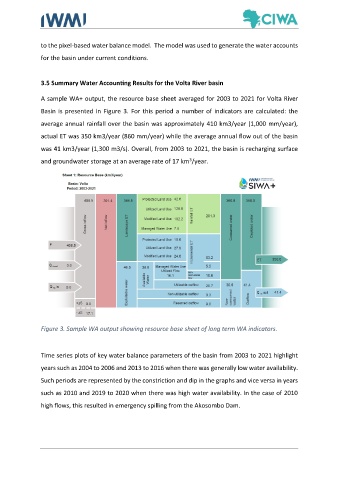
A sample WA+ output, the resource base sheet averaged for 2003 to 2021 for Volta River
Basin is presented in Figure 3. For this period a number of indicators are calculated: the
average annual rainfall over the basin was approximately 410 km3/year (1,000 mm/year),
actual ET was 350 km3/year (860 mm/year) while the average annual flow out of the basin
was 41 km3/year (1,300 m3/s). Overall, from 2003 to 2021, the basin is recharging surface
3
and groundwater storage at an average rate of 17 km /year.
Figure 3. Sample WA output showing resource base sheet of long term WA indicators.
Time series plots of key water balance parameters of the basin from 2003 to 2021 highlight
years such as 2004 to 2006 and 2013 to 2016 when there was generally low water availability.
Such periods are represented by the constriction and dip in the graphs and vice versa in years
such as 2010 and 2019 to 2020 when there was high water availability. In the case of 2010
high flows, this resulted in emergency spilling from the Akosombo Dam.