
Page 116 - CIWA Water Data Revolution Overview Report
P. 116
• Annual Rainfall: An overall annual decrease of 5.89% is projected, with totals dropping
from 1000.7 mm to 941.73 mm. This highlights a net reduction in water availability
under this scenario.
MPI-ESM1-2-HR Model:
• Wet Season: Rainfall is projected to increase by 16.21%, boosting totals to 1029 mm.
This suggests a wetter wet season, which could improve water resource availability
during critical agricultural periods.
• Dry Season: A marginal increase of 0.43% is anticipated, with dry-season totals rising
slightly to 118 mm. This negligible change indicates limited improvement in dry-
season water conditions.
• Annual Rainfall: An overall annual increase of 3.52% is projected, raising totals to
1035.9 mm. This indicates a more favorable outlook for water availability compared
to the GFDL-ESM4 model.
The contrasting projections underscore significant uncertainty in future rainfall patterns, with
the GFDL-ESM4 model indicating a drying trend and the MPI-ESM1-2-HR model suggesting
increased water availability. These variations highlight potential challenges for water
management in the Volta Basin, necessitating adaptive strategies to address seasonal shifts
and ensure water security under future climate conditions.
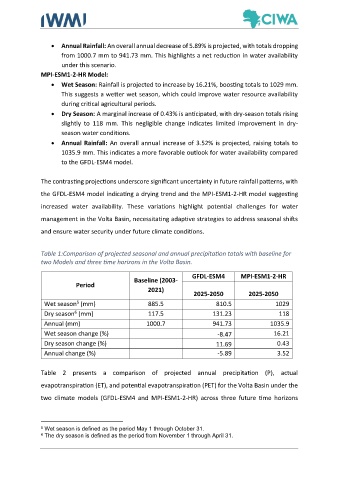
Table 1:Comparison of projected seasonal and annual precipitation totals with baseline for
two Models and three time horizons in the Volta Basin.
GFDL-ESM4 MPI-ESM1-2-HR
Baseline (2003-
Period
2021)
2025-2050 2025-2050
5
Wet season (mm) 885.5 810.5 1029
6
Dry season (mm) 117.5 131.23 118
Annual (mm) 1000.7 941.73 1035.9
Wet season change (%) -8.47 16.21
Dry season change (%) 11.69 0.43
Annual change (%) -5.89 3.52
Table 2 presents a comparison of projected annual precipitation (P), actual
evapotranspiration (ET), and potential evapotranspiration (PET) for the Volta Basin under the
two climate models (GFDL-ESM4 and MPI-ESM1-2-HR) across three future time horizons
5 Wet season is defined as the period May 1 through October 31.
6 The dry season is defined as the period from November 1 through April 31.