
Page 117 - CIWA Water Data Revolution Overview Report
P. 117
(2025–2030, 2025–2040, and 2025–2050), relative to the baseline period (2003–2021). Key
observations include:
Precipitation (P):
• GFDL-ESM4 Model: Precipitation is projected to decrease across all time horizons,
with annual totals declining from the baseline value of 1000.7 mm to 941.7 mm by
2025–2050. This reduction aligns with the model's overall drying trend for the region.
• MPI-ESM1-2-HR Model: In contrast, this model projects an increase in precipitation,
with annual totals rising to 1035.9 mm by 2025–2050. This highlights a wetter outlook
under this scenario.
Actual Evapotranspiration (ET):
• GFDL-ESM4 Model: ET is projected to decline slightly by 2025–2050 (893.0 mm),
suggesting that reduced water availability limits actual evaporation and transpiration
processes despite the potential for higher ET.
• MPI-ESM1-2-HR Model: ET is projected to increase slightly, reaching 983.6 mm by
2025–2050, indicating better water availability and higher evaporation rates in this
scenario.
Potential Evapotranspiration (PET):
For both models, PET is consistently projected to increase significantly compared to the
baseline (922.3 mm). By 2025–2050, PET rises to 2245.1 mm for the GFDL-ESM4 model and
2144.0 mm for the MPI-ESM1-2-HR model. This increase reflects rising temperatures and
solar radiation under future climate conditions, leading to greater atmospheric demand for
moisture.
Water Balance: The decline in ET for the GFDL-ESM4 model indicates a transition towards a
more water-limited and arid environment, driven by reduced precipitation. Despite higher
PET, the lack of sufficient rainfall constrains ET, reflecting water scarcity.
Water Availability: The MPI-ESM1-2-HR model presents a more favorable scenario, with
increased precipitation supporting higher ET and partially offsetting the rising PET demand.
Uncertainty: The divergence in projections between the two models underscores the
inherent uncertainty in climate change impacts, necessitating robust and adaptive water
resource management strategies for the Volta Basin. These findings emphasize the need to
prepare for both wetter and drier future scenarios.
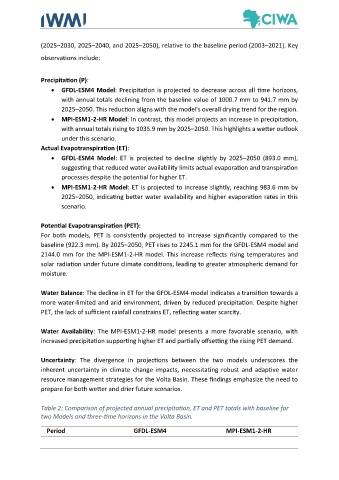
Table 2: Comparison of projected annual precipitation, ET and PET totals with baseline for
two Models and three-time horizons in the Volta Basin.
Period GFDL-ESM4 MPI-ESM1-2-HR