
Page 122 - CIWA-AR24
P. 122
Annexes
In terms of leveraging additional funds to The indicators found in CIWA’s Results
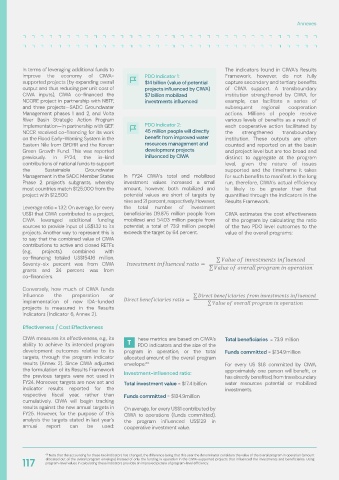
improve the economy of CIWA- PDO Indicator 1: Framework, however, do not fully
supported projects (by expanding overall $14 billion (value of potential capture secondary and tertiary benefits
output and thus reducing per unit cost of projects influenced by CIWA) of CIWA support. A transboundary
CIWA inputs), CIWA co-financed the $7 billion mobilized institution strengthened by CIWA, for
NCORE project in partnership with NBTF, investments influenced example, can facilitate a series of
and three projects—SADC Groundwater subsequent regional cooperation
Management phases 1 and 2, and Volta actions. Millions of people receive
River Basin Strategic Action Program various levels of benefits as a result of
Implementation—in partnership with GEF. PDO Indicator 2: each cooperative action facilitated by
NCCR received co-financing for its work 45 million people will directly the strengthened transboundary
on the Flood Early-Warning System in the benefit from improved water institution. These outputs are often
Eastern Nile from GFDRR and the Korean resources management and counted and reported on at the basin
Green Growth Fund. This was reported development projects and project level but are too broad and
previously. In FY24, the in-kind influenced by CIWA distinct to aggregate at the program
contributions of national funds to support level, given the nature of issues
the Sustainable Groundwater supported and the timeframe it takes
Management in the SADC Member States In FY24 CIWA‘s total and mobilized for such benefits to manifest. In the long
Phase 2 project’s subgrants, whereby investment values increased a small run, therefore, CIWA’s actual efficiency
most countries match $125,000 from the amount, however, both mobilized and is likely to be greater than that
project with $12,500. potential values are short of targets by quantified through the indicators in the
nine and 21 percent, respectively. However, Results Framework.
Leverage ratio = 1.32: On average, for every the total number of investment
US$1 that CIWA contributed to a project, beneficiaries (19.875 million people from CIWA estimates the cost effectiveness
CIWA leveraged additional funding mobilized and 54.03 million people from of the program by calculating the ratio
sources to provide input of US$1.32 to its potential; a total of 73.9 million people) of the two PDO level outcomes to the
projects. Another way to represent this is exceeds the target by 64 percent. value of the overall programs:
to say that the combined value of CIWA
contributions to active and closed RETFs
(e.g., projects), combined with
co-financing totaled US$154.16 million.
Seventy-six percent was from CIWA
grants and 24 percent was from
co-financiers.
Conversely, how much of CIWA funds
influence the preparation or
implementation of new IDA-funded
projects is measured in the Results
indicators (Indicator 6, Annex 2).
Effectiveness / Cost Effectiveness
CIWA measures its effectiveness, e.g., its hese metrics are based on CIWA’s Total beneficiaries = 73.9 million
T
ability to achieve its intended program PDO indicators and the size of the
development outcomes relative to its program in operation, or the total Funds committed = $134.9million
targets, through the program indicator allocated amount of the overall program
results (Annex 2). Since CIWA adjusted envelope. 60 For every US $1.8 committed by CIWA,
the formulation of its Results Framework approximately one person will benefit, or
the previous targets were not used in Investment-influenced ratio: has directly benefited, from transboundary
FY24. Moreover, targets are now set and Total investment value = $17.4 billion water resources potential or mobilized
indicator results reported for the investments.
respective fiscal year, rather than Funds committed = $134.9million
cumulatively. CIWA will begin tracking
results against the new annual targets in On average, for every US$1 contributed by
FY25. However, for the purpose of this CIWA to operations (funds committed),
analysis the targets stated in last year’s the program influenced US$129 in
annual report can be used: cooperative investment value.
60 Note that the accounting for these two indicators has changed, the difference being that this year the denominator considers the value of the overall program in operation (amount
allocated out of the overall program envelope) instead of only the funding in operation in the CIWA-supported projects that influenced the investments and beneficiaries. Using
117 program-level values in calculating these indicators provides an improved picture of program-level efficiency.