
Page 48 - CIWA Water Data Revolution Overview Report
P. 48
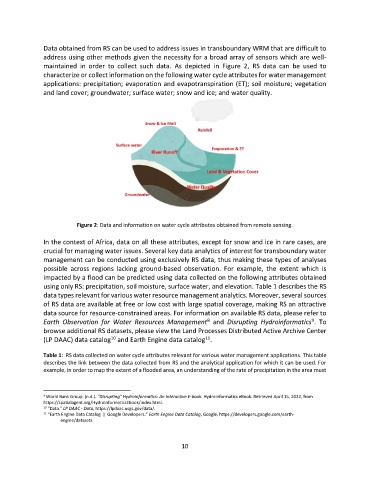
Data obtained from RS can be used to address issues in transboundary WRM that are difficult to
               address using other methods given the necessity for a broad array of sensors which are well-
               maintained  in  order  to  collect  such  data.  As  depicted  in  Figure  2,  RS  data  can  be  used  to
               characterize or collect information on the following water cycle attributes for water management
               applications: precipitation; evaporation and evapotranspiration (ET); soil moisture; vegetation
               and land cover; groundwater; surface water; snow and ice; and water quality.


                          Figure 2: Data and information on water cycle attributes obtained from remote sensing.

               In the context of Africa, data on all these attributes, except for snow and ice in rare cases, are
               crucial for managing water issues. Several key data analytics of interest for transboundary water
               management can be conducted using exclusively RS data, thus making these types of analyses
               possible  across  regions  lacking  ground-based  observation.  For  example,  the  extent  which  is
               impacted by a flood can be predicted using data collected on the following attributes obtained
               using only RS: precipitation, soil moisture, surface water, and elevation. Table 1 describes the RS
               data types relevant for various water resource management analytics. Moreover, several sources
               of RS data are available at free or low cost with large spatial coverage, making RS an attractive
               data source for resource-constrained areas. For information on available RS data, please refer to
                                                                      8
                                                                                                        9
               Earth  Observation  for  Water  Resources  Management   and  Disrupting  Hydroinformatics .  To
               browse additional RS datasets, please view the Land Processes Distributed Active Archive Center
                                      10
                                                                     11
               (LP DAAC) data catalog  and Earth Engine data catalog .

               Table 1:  RS data collected on water cycle attributes relevant for various water management applications. This table
               describes the link between the data collected from RS and the analytical application for which it can be used. For
               example, in order to map the extent of a flooded area, an understanding of the rate of precipitation in the area must


               9  World Bank Group. (n.d.). "Disrupting" HydroInformatics: An Interactive E-book. Hydroinformatics eBook. Retrieved April 15, 2022, from
               https://spatialagent.org/HydroInformaticsEbook/index.html.
               10  “Data.” LP DAAC - Data, https://lpdaac.usgs.gov/data/.
               11  “Earth Engine Data Catalog  |  Google Developers.” Earth Engine Data Catalog, Google, https://developers.google.com/earth-
                     engine/datasets.


                                                             10