
Page 111 - CIWA AR25
P. 111
Annexes
CIWA achieves lower costs by basing budgets for projects on additional sources of funding for RETF projects, thereby
14
a careful assessment of estimated costs and through effective reducing its unit cost of inputs in relation to the overall sum
procurement processes, cost-sharing, and greater travel of outputs it mobilizes. CIWA uses the following metric as an
efficiencies, using video connection for meetings when possible, indicator of increased economy due to leveraging of funds
convening CIWA meetings back-to-back when feasible, and from additional sources:
linking to other water sector-related meetings to take advantage
of synergies. Within the overall 6 percent range, the program Σ Funds leveraged from additional sources for CIWA projects
manager has the discretion to allocate additional preparation or Leverage ratio =
supervision funds to individual projects based on need. Σ CIWA contributions to cofinanced projects
Effi ciency
• Leverage Ratio—CIWA improves its economy by leveraging
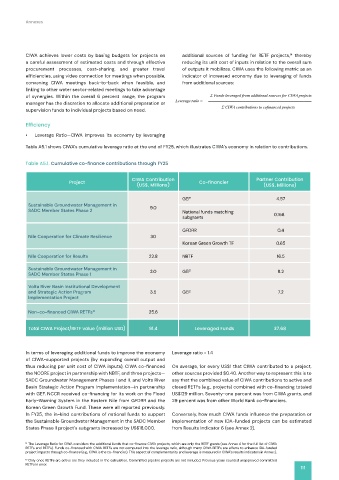
Table A5.1 shows CIWA’s cumulative leverage ratio at the end of FY25, which illustrates CIWA’s economy in relation to contributions.
Table A5.1. Cumulative co-fi nance contributions through FY25
CIWA Contribution Partner Contribution
Project Co-fi nancier
(US$, Millions) (US$, Millions)
GEF 4.57
Sustainable Groundwater Management in 9.0
SADC Member States Phase 2 National funds matching
subgrants 0.158
GFDRR 0.4
Nile Cooperation for Climate Resilience 30
Korean Green Growth TF 0.65
Nile Cooperation for Results 22.8 NBTF 16.5
Sustainable Groundwater Management in 2.0 GEF 8.2
SADC Member States Phase 1
Volta River Basin Institutional Development
and Strategic Action Program 3.5 GEF 7.2
Implementation Project
Non-co-financed CIWA RETFs 15 25.6
Total CIWA Project/RETF value (million USD) 91.4 Leveraged Funds 37.68
In terms of leveraging additional funds to improve the economy Leverage ratio = 1.4
of CIWA-supported projects (by expanding overall output and
thus reducing per unit cost of CIWA inputs), CIWA co-financed On average, for every US$1 that CIWA contributed to a project,
the NCORE project in partnership with NBTF, and three projects— other sources provided $0.40. Another way to represent this is to
SADC Groundwater Management Phases I and II, and Volta River say that the combined value of CIWA contributions to active and
Basin Strategic Action Program Implementation—in partnership closed RETFs (e.g., projects) combined with co-financing totaled
with GEF. NCCR received co-financing for its work on the Flood US$129 million. Seventy-one percent was from CIWA grants, and
Early-Warning System in the Eastern Nile from GFDRR and the 29 percent was from other World Bank co-financiers.
Korean Green Growth Fund. These were all reported previously.
In FY25, the in-kind contributions of national funds to support Conversely, how much CIWA funds influence the preparation or
the Sustainable Groundwater Management in the SADC Member implementation of new IDA-funded projects can be estimated
States Phase II project’s subgrants increased by US$18,000. from Results Indicator 6 (see Annex 2).
14 The Leverage Ratio for CIWA considers the additional funds that co-fi nance CIWA projects, which are only the RETF grants (see Annex 4 for the full list of CIWA
RETFs and BETFs). Funds co-financed with CIWA BETFs are not computed into the leverage ratio, although many CIWA BETFs are efforts to enhance IDA-funded
project impacts through co-finance (e.g., CIWA is the co-financier). This aspect of complementarity and leverage is measured in CIWA’s results indicators in Annex 2.
15 Only once RETFs are active are they included in the calculation. Committed pipeline projects are not included. Previous years counted unapproved committed
RETFs in error.
111