
Page 106 - CIWA AR25
P. 106
Annexes
Income, Disbursement & Funding Balance
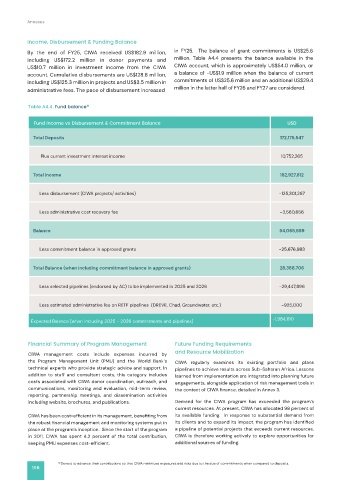
By the end of FY25, CIWA received US$182.9 million, in FY25. The balance of grant commitments is US$25.6
including US$172.2 million in donor payments and million. Table A4.4 presents the balance available in the
US$10.7 million in investment income from the CIWA CIWA account, which is approximately US$54.0 million, or
account. Cumulative disbursements are US$128.8 million, a balance of -US$1.9 million when the balance of current
including US$125.3 million in projects and US$3.5 million in commitments of US$25.6 million and an additional US$29.4
administrative fees. The pace of disbursement increased million in the latter half of FY26 and FY27 are considered.
Table A4.4. Fund balance 10
Fund Income vs Disbursement & Commitment Balance USD
Total Deposits 172,175,547
Plus current investment interest income 10,752,265
Total Income 182,927,812
Less disbursement (CIWA projects/ activities) -125,301,267
Less administrative cost recovery fee -3,560,856
Balance 54,065,689
Less commitment balance in approved grants -25,676,983
Total Balance (when including commitment balance in approved grants) 28,388,706
Less selected pipelines (endorsed by AC) to be implemented in 2025 and 2026 -29,447,896
Less estimated administrative fee on RETF pipelines (DREVE, Chad, Groundwater, etc.) -925,000
Expected Balance (when including 2025 - 2026 commitments and pipelines) -1,984,190
Financial Summary of Program Management Future Funding Requirements
CIWA management costs include expenses incurred by and Resource Mobilization
the Program Management Unit (PMU) and the World Bank’s CIWA regularly examines its existing portfolio and plans
technical experts who provide strategic advice and support. In pipelines to achieve results across Sub-Saharan Africa. Lessons
addition to staff and consultant costs, this category includes learned from implementation are integrated into planning future
costs associated with CIWA donor coordination, outreach, and engagements, alongside application of risk management tools in
communications, monitoring and evaluation, mid-term review, the context of CIWA finance, detailed in Annex 3.
reporting, partnership meetings, and dissemination activities
including website, brochures, and publications. Demand for the CIWA program has exceeded the program’s
current resources. At present, CIWA has allocated 98 percent of
CIWA has been cost-efficient in its management, benefiting from its available funding. In response to substantial demand from
the robust financial management and monitoring systems put in its clients and to expand its impact, the program has identified
place at the program’s inception. Since the start of the program a pipeline of potential projects that exceeds current resources.
in 2011, CIWA has spent 4.2 percent of the total contribution, CIWA is therefore working actively to explore opportunities for
keeping PMU expenses cost-efficient. additional sources of funding.
10 Donors to advance their contributions so that CIWA minimizes exposures and risks due to the size of commitments when compared to deposits.
106