
Page 57 - CIWA Water Data Revolution Overview Report
P. 57
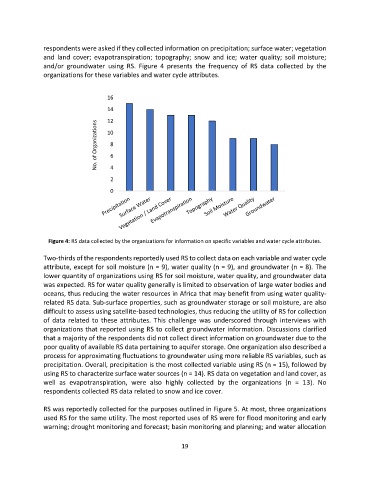
respondents were asked if they collected information on precipitation; surface water; vegetation
               and  land  cover;  evapotranspiration;  topography;  snow  and  ice;  water  quality;  soil  moisture;
               and/or  groundwater  using  RS.  Figure  4  presents  the  frequency  of  RS  data  collected  by  the
               organizations for these variables and water cycle attributes.


                                     16
                                     14
                                     12
                                 No. of Organizations  10


                                      8

                                      6
                                      4
                                      2

                                      0


                 Figure 4: RS data collected by the organizations for information on specific variables and water cycle attributes.

               Two-thirds of the respondents reportedly used RS to collect data on each variable and water cycle
               attribute, except for soil moisture (n = 9), water quality (n = 9), and groundwater (n = 8). The
               lower quantity of organizations using RS for soil moisture, water quality, and groundwater data
               was expected. RS for water quality generally is limited to observation of large water bodies and
               oceans, thus reducing the water resources in Africa that may benefit from using water quality-
               related RS data. Sub-surface properties, such as groundwater storage or soil moisture, are also
               difficult to assess using satellite-based technologies, thus reducing the utility of RS for collection
               of  data  related  to these  attributes.  This  challenge  was  underscored through  interviews with
               organizations that reported using RS to collect groundwater information. Discussions clarified
               that a majority of the respondents did not collect direct information on groundwater due to the
               poor quality of available RS data pertaining to aquifer storage. One organization also described a
               process for approximating fluctuations to groundwater using more reliable RS variables, such as
               precipitation. Overall, precipitation is the most collected variable using RS (n = 15), followed by
               using RS to characterize surface water sources (n = 14). RS data on vegetation and land cover, as
               well  as  evapotranspiration,  were  also  highly  collected  by  the  organizations  (n  =  13).  No
               respondents collected RS data related to snow and ice cover.

               RS was reportedly collected for the purposes outlined in Figure 5. At most, three organizations
               used RS for the same utility. The most reported uses of RS were for flood monitoring and early
               warning; drought monitoring and forecast; basin monitoring and planning; and water allocation


                                                             19