
Page 81 - CIWA AR25
P. 81
Annexes
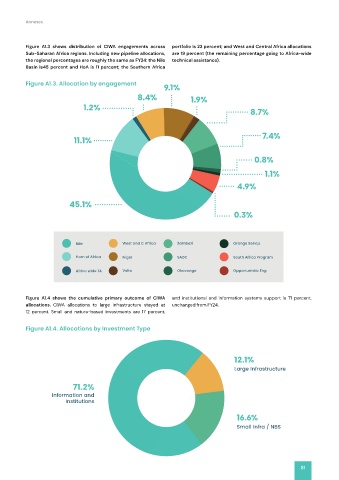
Figure A1.3 shows distribution of CIWA engagements across portfolio is 23 percent; and West and Central Africa allocations
Sub‑Saharan Africa regions. Including new pipeline allocations, are 19 percent (the remaining percentage going to Africa‑wide
the regional percentages are roughly the same as FY24: the Nile technical assistance).
Basin is45 percent and HoA is 11 percent; the Southern Africa
Figure A1.3. Allocation by engagement
9.1%
8.4%
8.4% 1.9%
1.2%
8.7%
7.4%
11.1%
0.8%
1.1%
4.9%
45.1%
0.3%
Nile West and C Africa Zambezi Orange Senqu
Horn of Africa Niger SADC South Africa Program
Africa wide TA Volta Okavango Opportunistic Eng
Figure A1.4 shows the cumulative primary outcome of CIWA and institutional and information systems support is 71 percent,
allocations. CIWA allocations to large infrastructure stayed at unchanged from FY24.
12 percent. Small and nature-based investments are 17 percent,
Figure A1.4. Allocations by Investment Type
Figure A1.4. Allocations by Investment Type
12.1%
Large Infrastructure
71.2%
nd
f
t
ma
or
n
a
I Information and
i
on
Institutions
Institutions
16.6%
Small Infra / NBS
81