Page 80 - CIWA AR25
P. 80

Annexes
          A n n exe s


          ANNEX 1 — Allocations


                                                                                           5
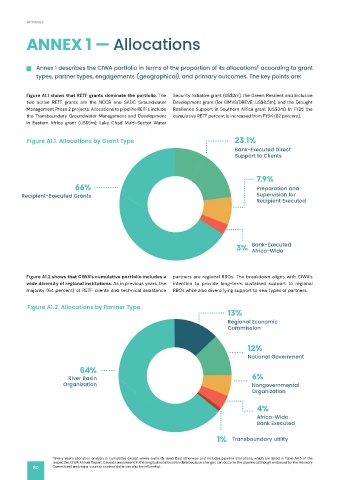
              Annex 1 describes the CIWA portfolio in terms of the proportion of its allocations  according to grant
              types, partner types, engagements (geographical), and primary outcomes. The key points are:


          Figure A1.1 shows that RETF grants dominate the portfolio. The   Security Initiative grant (US$2m), the Green, Resilient and Inclusive
          two  active  RETF  grants  are  the  NCCR  and  SADC  Groundwater   Development grant (for OMVS/DREVE; US$8.5m), and the Drought
          Management Phase 2 projects. Allocations to pipeline RETFs include   Resilience Support in Southern Africa grant (US$3m). In FY25 the
          the  Transboundary  Groundwater  Management  and  Development   cumulative RETF percent is increased from FY24 (62 percent).
                                      k
                                     a
                                      e
                                          a
                                           d
                                        C
                                         h
                              S
                               $
                             (
                             U
                                5
                                   ,
                                    L
                                 m
                                  )
                                                     o
                                                      r
                                                   c
                                                    t
                                                         te
                                                           r
                                                       W
                                                        a
                                               l
                                                t
                                             M
                                              u
                                                 S
                                                  e
                                                i
                                                -
          i in  Eastern  Africa  grant  (US$5m),  Lake  Chad  Multi-Sector  Water
                   A
                 n
                     i
                    r
                    f
             a
            E
           n
                r
               te
              s
                         r
                        g
                         a
                           t
                          n
                      a
                     c
          Figure A1.1. Allocations by Grant Type                                   23.1%
                                                                                   Bank-Executed Direct
                                                                                   Support to Clients
                                                                                           7.9%
                           66%                                                             Preparation and
                                                                                           Preparation and
         Recipient-Executed Grants                                                         Supervision for
                                                                                           Recipient Executed
                                                                                         Bank-Executed
                                                                                    3%
                                                                                         Africa-Wide
                                                              partners  are  regional  RBOs.  The  breakdown  aligns  with  CIWA’s
          Figure A1.2 shows that CIWA’s cumulative portfolio includes a   partners  are  regional  RBOs.  The  breakdown  aligns  with  CIWA’s
                                                              intention  to  provide  long-term  sustained  support  to  regional
          wide diversity of regional institutions. As in previous years, the   intention  to  provide  long-term  sustained  support  to  regional
          majority (64 percent) of RETF clients and technical assistance   RBOs while also diversifying support to new types of partners.
           Figure A1.2. Allocations by Partner Type
                                                                                 13%
                                                                                 Regional Economic
                                                                                 Commission
                                                                                        12%
                                                                                        National Government
                             64%
                                                                                          6%
                         River Basin
                       Organization
                       Organization                                                       Nongovernmental
                                                                                          Organization
                                                                                           4%
                                                                                           Africa-Wide
                                                                                           Bank Executed
                                                                             1%    Transboundary utility
                    5  Every year’s allocation analysis is cumulative except where explicitly described otherwise and includes pipeline allocations, which are listed in Table A4.5 of the
                    respective CIWA Annual Report. Caveats are present in the longitudinal allocation data because changes can occur in the pipeline (although endorsed by the Advisory

                    Committee) and major country context shifts can also be influential.
             80
   75   76   77   78   79   80   81   82   83   84   85