
Page 147 - CIWA Water Data Revolution Overview Report
P. 147
5.2.1 Dashboard interface, functionality and technical specifications: detailed
walkthrough, Basic knowledge of Tableau
The session on the dashboard interface, functionality, and technical specifications was led by
Harim, the dashboard developer who presented online. She provided participants with a
detailed walkthrough of the Incomati and Maputo basin Water Accounting dashboard,
demonstrating its features and interactivity. Participants were guided through key
functionalities, including how to view the country portions of the basin water accounts, view
basin overview statistics, and access various water accounting indicators across different
years. Key visual tools such as pie charts, heat maps, and their utility in understanding water
resource dynamics illustrated. The interactive Sankey diagram and its role in illustrating water
accounts within the basins was illustrated.
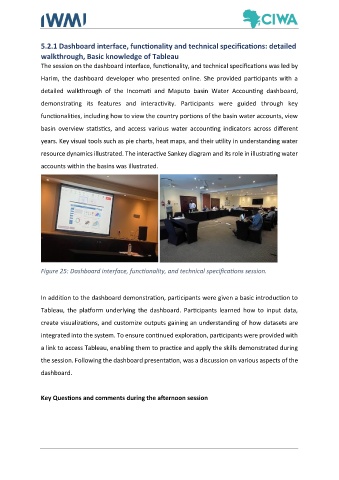
Figure 25: Dashboard interface, functionality, and technical specifications session.
In addition to the dashboard demonstration, participants were given a basic introduction to
Tableau, the platform underlying the dashboard. Participants learned how to input data,
create visualizations, and customize outputs gaining an understanding of how datasets are
integrated into the system. To ensure continued exploration, participants were provided with
a link to access Tableau, enabling them to practice and apply the skills demonstrated during
the session. Following the dashboard presentation, was a discussion on various aspects of the
dashboard.
Key Questions and comments during the afternoon session